
In the previous post about the pilot deployment I mentioned that one of the variables that only surfaced on a real production line was curvature - of both the products and the production boards. The topic deserves its own post, because curvature is a peculiar defect described in the PN-EN 1339 standard: practically undetectable to the naked eye, while generating very real costs, from complaints to excess material consumption.
What is product curvature and where does it come from?
Curvature is the deviation of the product's top surface from an ideal plane. A slab can be tilted (one edge higher than the other), bulged, or sunken in the middle. We're talking about values of 1-3 mm, and that's the crux of the problem: neither the operator on the line nor a quality inspector with calipers will spot a difference like that.
There are usually three sources of curvature:
- worn or bent production boards the product is formed on - a curved board reproduces itself in every cycle it works in,
- uneven dosing and compaction of the mix in the mould,
- wear of the mould itself.
Each of these causes leaves a different footprint, and that's the good news I'll come back to with the heatmaps.
How do you measure curvature on a production line?
Our system uses the architecture described in the earlier posts in this series: a line laser set at a 45° angle and an industrial camera analyzing the deflections of the laser line. At this angle the line's deflection directly equals the product's height, and the measurement is contactless, across the full pass of the board, for 100% of production.
What's key for curvature is measurement density. For every slab we record several thousand measurement points, accurate to 0.5 mm. A height median is derived from these points, but more importantly, the points are not averaged down to a single number. Every board gets its own height scale, and all the points are mapped onto a heatmap.
This is what a board where everything is fine looks like:
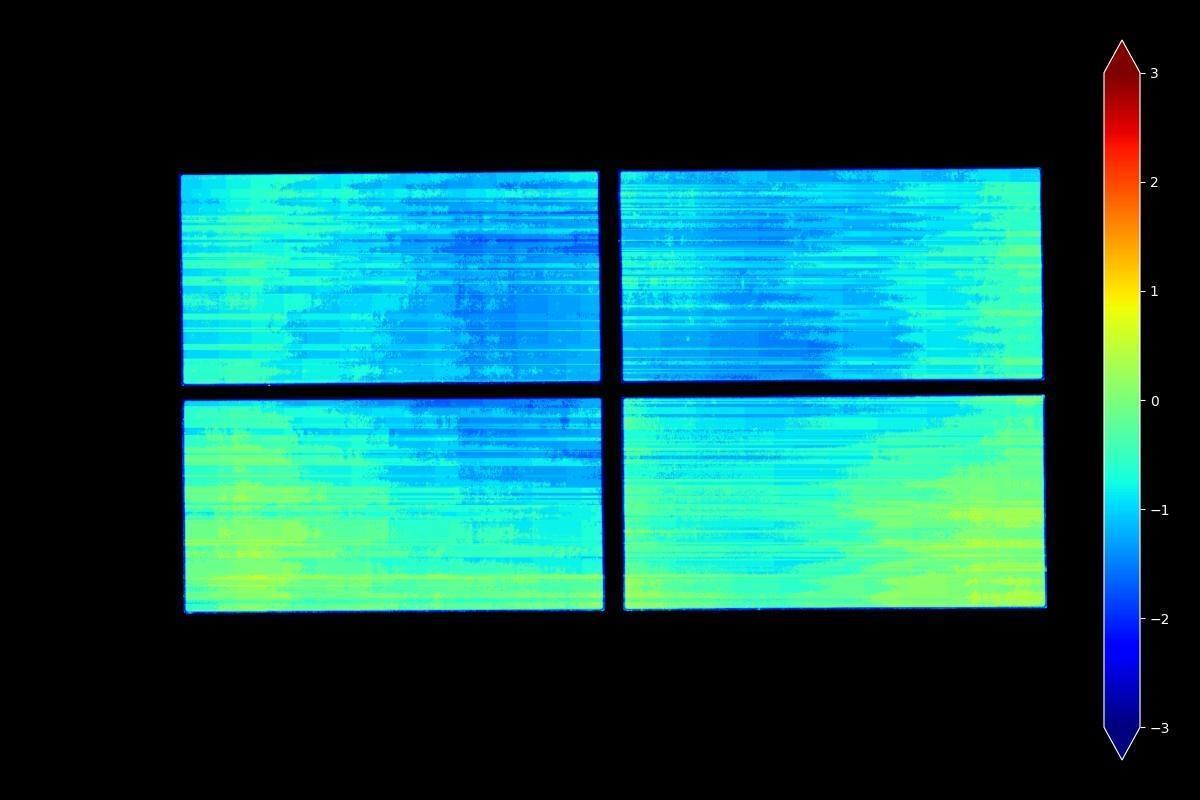
Fig. 1: Height heatmap of a board with no significant curvature. The whole surface stays within a narrow band around zero on the scale - the product is flat, the board is even.
And this is a board with curvature:
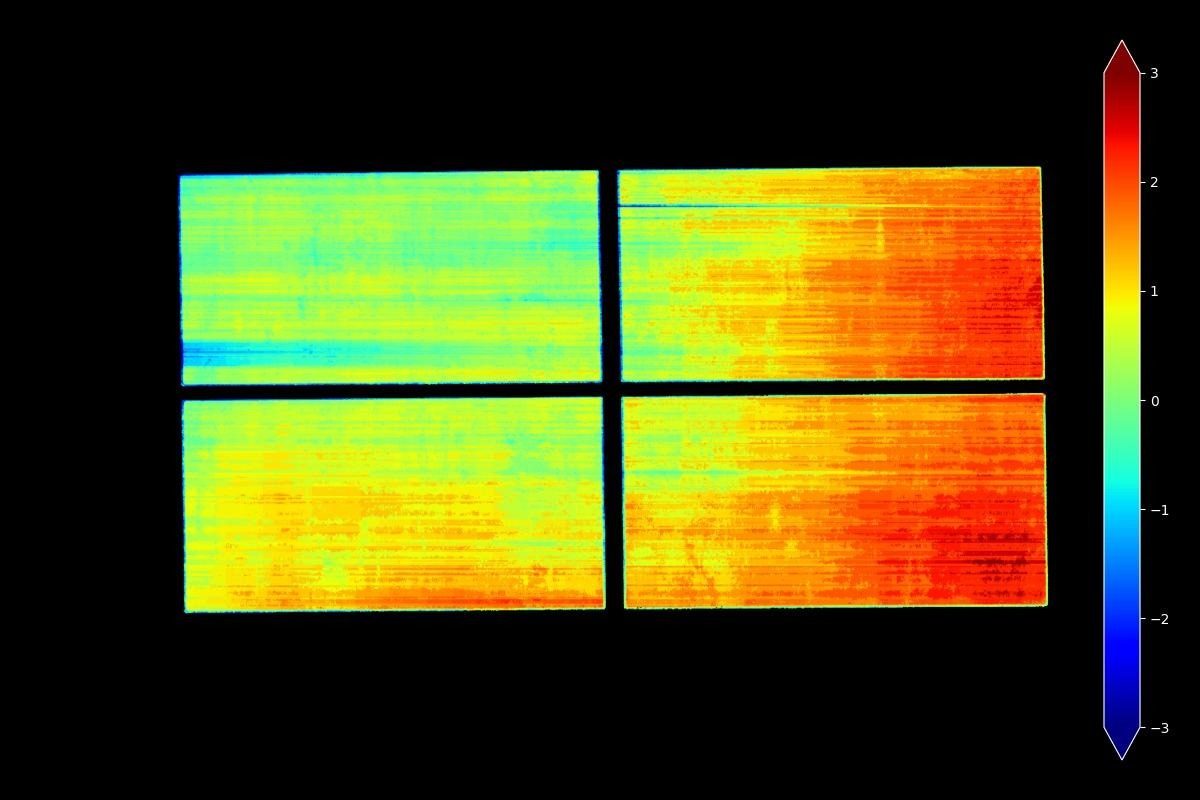
Fig. 2: The same scale, a different board. A clear height gradient - from values close to zero up to deviations of +2-3 mm. To the naked eye, both boards look identical.
The difference between Fig. 1 and Fig. 2 is invisible on the factory floor. On the heatmap it shows from the very first scan.
Product curvature or board curvature?
Measuring height at thousands of points lets you distinguish two things that blur into one in a single measurement:
- Product curvature - local, affecting a specific slab or group of slabs; it points to the mould, the tamper head or the mix dosing.
- Board curvature - a global gradient across the whole board, as in Fig. 2; it comes back cyclically with the same board, regardless of the product.
The distinction matters in practice: you react differently to a worn mould than to a batch of boards due for replacement. A system that sees every cycle can point to the specific boards that are ruining the result - instead of leaving the technologist with a vague "something's wrong with the height".
What does curvature detection really give the business?
The answer is different for every role in production - and it's worth separating them.
Management: the scale of the problem in numbers, not opinions. Without continuous measurement, curvature is a topic management learns about from individual complaints, after the fact and without context. The system aggregates data from 100% of production into a synthetic report: what percentage of boards show curvature, on which lines, moulds and boards the problem is growing, what share of the produced surface is defective. Instead of reacting to individual returns, management manages a problem whose scale it knows down to the board.
Production manager: reaction in minutes instead of hours. Without continuous measurement, a curvature problem can run for hours before anyone notices, and all that time the line keeps producing defective products. With a heatmap on every cycle the deviation is visible immediately, and batches, shifts and operators can be compared 1:1, without manually stitching reports together.
Technologist: the heatmap is a diagnosis, not just an alarm. The shape of the deviation points to the cause. A gradient across the whole board - the board. A repeatable bulge in the same spot of the mould - the tamper head or the dosing. A trend building up over weeks - wear. Instead of experimenting blindly, the technologist gets a map that shows where to look.
Operator: information right away, at the workstation. The dashboard shows the scan result live. The operator doesn't find out about a problem later - they see it in the very cycle it occurred and can react before it grows into a stack of defective products.